Every now and then, Google announces a change to its ranking signals that determine the order of web pages it will show in response to a search query. It’s not often Google lets us in on their algorithm secrets, so when they do, it’s worth sitting up straight...
That’s if you’re interested in organically optimising your website.
Their most recent ranking change started rolling out on Google Search and was expected to be complete by the end of August 2021. The change introduced new signals to their Page Experience algorithm to determine:
- The usability of websites
- How performant sites are at delivering content to screen
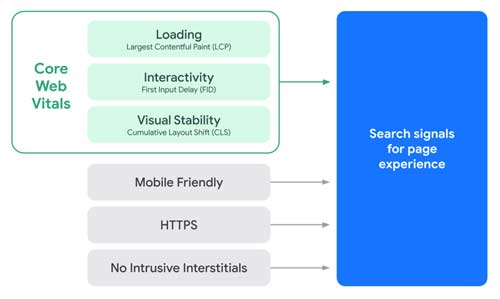
Basically, the speed police: page speed and responsiveness. They've called these new signals Core Web Vitals, which consist of three metrics that carry extra weight when ranking your website.
Why have Core Web Vitals been updated?
Chrome’s developers aimed to capture a rounded user’s experience of webpages in response to page interactions, attentive to:
- Loading of the webpage
- How the page responds to user input
- Smooth scrolling and animation
Basically, the usability of pages and their load time.
The metrics may have some website owners in a bit of a panic, but they're actually a great asset if we consider longer load times cause visitors to abandon a site. According to Google, 90% may leave a page if it takes 5 seconds to load. So for every second your page is delayed, you risk losing your audience.
No site owner wants to disappoint their audience, so the tools can be helpful to see the website’s performance figures in black and white to optimise those crucial loading seconds.
What do I need to know?
Google will be evaluating your site with three metrics over a 28-day period; hit their benchmark and you’ll be awarded a pass with ranking kudos.
Don’t panic if your site isn’t hitting the mark — these are not the only signals that measure page rank. Google says the performance metrics don’t override ranking points awarded for having great relevant content. That means catering for usability and investing in quality content will win hands-down each time.
We also need to consider it's Google's robots that perform the evaluation. What Google’s intelligent data thinks it knows about your site versus reality — there may be differences.
Having said that, taking a performance audit of your site is painless, super quick and provides you with the glasses to see what areas you can improve for your visitors. Even better — it’s free!
Should I be worried?
Don’t worry if your site doesn’t perform as well as you'd expect — most site owners will be in the same boat and may not have heard the term ‘user experience’. We find this with most businesses we work with because they are so focused on their own goals - which is completely normal.
And these new signals are just a percentage of existing search signals running alongside hundreds of other Google ranking factors.
On the other hand, the best websites are fast. Google says 53% will leave a mobile page that takes 3 seconds to load.
HTTP Archives reports many websites are still slow, despite the internet being much quicker than it was 10 years ago.
Just make sure you fall into the fast category.
There’s no evidence to suggest Google will remove slow sites from their indexing, and even if your score is fantastic that alone isn’t going to magically place you in the #1 sweet spot. But having a lens that provides opportunities for web page improvements is a great tool if it means your visitors receive a better browsing experience.
Do I need to do anything?
Your team should consider using free auditing tools if performance is on your roadmap (and it should be). If you want to dig into your metrics, I’d suggest you stick with Google’s tools, so you can see straight from the horse’s mouth what it thinks it knows about you. I recommend:
- The Page Experience report found in Google's Search console. This combines the new core metric’s reporting with other significant ranking signals, such as mobile-friendliness
- PageSpeed Insights to see how you compare against your competitors
The Page Experience report will provide you with a list of actionable insights suggested for improving the different aspects of your user’s experience in terms of metrics. And there’s a helpful infographic showing a percentage of URLs that Google rates as having a good experience on your site.
What do the metrics mean?
If that sounds confusingly complex, I’ve wrapped up the meaning for each of the three core metrics...
Largest Contentful Paint (LCP)
LCP measures the number of seconds it takes for the largest content to appear settled in the viewport, for the user to start reading without the content jumping about. A high LCP indicates a poor loading performance.
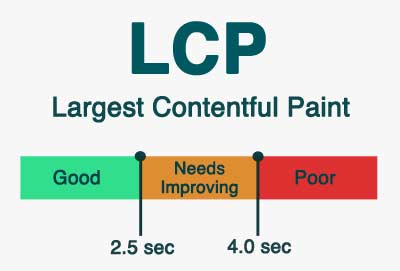
Google suggests you aim for an LCP of 2.5 seconds to provide an ideal user experience.
Getting stuff done on the server helps here, taking the load off the browser so it can focus on quickly painting content to the screen.
Images are usually the largest content and contain the most significant data. It’s common for them to take up half of a mobile’s page weight, so make sure to:
- Optimise images
- Serve images close to their displayed size
- Target devices
This will reduce the page weight and be faster to load especially for those on a mobile network, leading to a better-perceived performance that can positively impact the user experience and LCP metric.
People don’t hang about waiting for sites to load. Google sees 47% of visitors expect a site to load within 2 seconds, meaning every second delayed risk you losing credibility and revenue. So if your business relies on the power of online marketing, optimising loading speed guided by the LCP metric can be helpful.
First Input Delay (FID)
FID measures interactivity. Measuring how long it takes the browser to deal with user interaction.
For example, when a user clicks a button, how long does it take the browser to respond to the click?
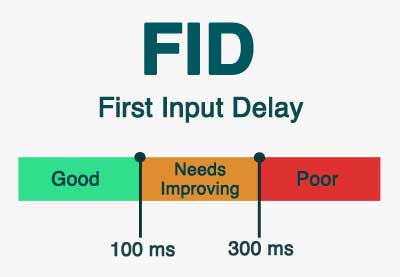
According to Google, the browser should respond within 100ms to register a good experience.
Ensuring the browser’s not distracted or weighed down by rendering javascript or fetching content from the server helps here. Otherwise, it’s Groundhog Day — everything on the page grinds to a halt whilst the browser displays the visuals, which includes responding to that button.
Obviously, that’s entirely out of your control. Any good web designer will know the tricks to lazy load or run a fetch asynchronously to control render-blocking and help the browser perform at its optimum.
Cumulative Layout Shift (CLS)
CLS aims to make the page as delightful as possible by measuring its visual stability. It measures if the user witnesses a visible element changing from one position to another.
If you’ve ever been disorientated by a button suddenly jumping from one place to the next, that’s CLS in action.
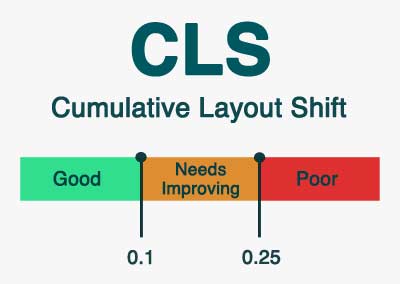
The aim is a CLS score of 0.1. or less.
Pages styled and coded responsively to breakpoints, only changing their layout when the layout breaks, will improve the CLS score because it allows the page elements to flow naturally into position. Again these are tips any good web designer should understand.
How can I test my CWV results?
Knowing how you’re rated by Google is great, but it shouldn’t be a replacement tool for real human testing. And it’s equally important not to let a robot intimidate you.
Your users are your business intelligence tools
If you want to sanity check usability flaws and performance to see how you stack up in the real world, take a good hard look at your site and assess with a usability testing session:
- Set yourself some goals incorporating the three metrics mentioned above
- Evaluate your goals on 3–5 testing participants who identify as your target audience
Then use your data to address any issues your visitors experience. This will allow you to focus on the relationship between the user and your web page rather than on how a robot thinks it understands them.
How can Holistic help?
A usability testing session followed by an audit of your site will investigate room for improvement. If your website’s been around for some time, we may see signs of:
- Several outdated design elements
- Unnecessary bytes of code
- Too many server trips
Usually, images are the worst offenders.
Testing and metrics are beautifully complex and come in a variety of flavours. How to improve them will be based on various factors. There are different ways to tackle web builds and improve ranking; Holistic favours an organic ranking approach, which combines:
- Your business goals
- Audience needs
- Modern infrastructure baked in SEO and accessibility
These combine beautifully to create a solid foundation for any successful web project.
Conclusion
I think we’ll be hearing a lot more about algorithms focusing on the user’s experience in years to come. Combining the metrics with usability testing will help to pay close attention to your users and keep them at the heart of any design improvements, which will better inform your user engagement and organic ranking strategy.
We hope to inspire you to adopt a user experience culture for your website and invite you to reach out to us for support should you need it.